Most teams spend their time optimising the wrong metric. They celebrate connection acceptance rates, track campaign volume, and measure how many messages went out. But the number that actually predicts pipeline — the one that separates outreach that builds conversations from outreach that builds a muted list — is LinkedIn reply rate.
In 2026, the gap between average and strong reply rates has widened significantly. AI-generated outreach has flooded inboxes. LinkedIn’s detection systems have tightened. The professionals receiving these messages have become much better at identifying — and ignoring — what was not written for them. At the same time, teams that understand what drives replies are generating more conversations with fewer sends than ever before.
This is a complete breakdown of LinkedIn reply rate benchmarks in 2026: what the numbers mean, how they differ by channel, industry, role, and timing, and what specifically moves them.
A high acceptance rate means someone let you in. A reply means they thought you were worth their time. Only one of those builds pipeline.
What Is LinkedIn Reply Rate and Why It Is the Metric That Matters
LinkedIn reply rate is the percentage of prospects who respond to your outreach message. The formula is simple:
(Total replies ÷ Total messages sent) × 100 = Reply rate %
Reply rate is the metric that matters most. A high acceptance rate means someone was willing to let you in. That is a low-commitment action. A reply means they invested time in what you sent. That is the action that opens pipeline.
If your reply rate is low, fixing it fixes everything downstream. It is the earliest signal of targeting quality, message relevance, and sequence design — all visible before a single meeting is booked.
Reply Rate vs. Acceptance Rate: Why You Need Both
| Metric | What It Measures | What It Tells You | 2026 Benchmark |
|---|---|---|---|
| Connection acceptance rate | % of requests accepted | Targeting quality + profile credibility | 30–45% healthy; above 40% strong |
| Reply rate | % of messages that receive a response | Message relevance + personalisation quality + sequence design | 10–25% average; 25–35% strong; 35–50%+ top tier |
| Positive reply rate | % of replies showing genuine interest | Offer fit + ICP precision + value framing | 25–35% of all replies for high performers |
These three metrics tell a sequential story. Acceptance rate tells you whether the right people are opening the door. Reply rate tells you whether your message made them want to talk. Positive reply rate tells you whether the conversation had commercial value.
Your acceptance rate tells you whether the door opened. Your reply rate tells you whether anyone wanted to walk through it.
What Is a Good LinkedIn Reply Rate in 2026?
There is no single answer. But there are clear tiers — and knowing which one you are in tells you exactly what to fix.
| Performance Tier | Reply Rate | What It Signals |
|---|---|---|
| Below average | Below 10% | Targeting is off, message is generic, or sequence has only one touch |
| Average | 10–15% | Outreach is functional but not differentiated. Personalisation is likely surface-level. |
| Good | 15–25% | Targeting is solid. Message quality is above average. Sequence has follow-up. |
| Strong | 25–35% | Signal-based outreach. Personalisation references specific context. Multi-touch sequence working. |
| Top tier | 35–50%+ | Warm leads, high intent signals, strong brand presence. Hyper-relevant messaging at exactly the right moment. |
Below 10% is not bad luck. It is a signal. Something upstream — targeting, message, sequence — is broken.
Important caveat: these tiers apply to direct messages sent to first-degree connections. InMail operates on a different baseline entirely — covered in the channel breakdown below.
LinkedIn Reply Rate Benchmarks by Channel
Not all LinkedIn outreach works the same way. The channel you use — connection request with follow-up DM, InMail, Messenger campaign, group message — determines both your baseline and your ceiling.
| Channel | Average Reply Rate | High Performer Rate | Key Condition |
|---|---|---|---|
| Direct message (1st-degree connections) | 10–15% | 25–35% | Post-acceptance DM with personalised hook |
| Messenger campaign (1st-degree) | 11.72–16.86% | 25–35% | Highest trust; direct inbox; no connection friction |
| Cold InMail | 6.38–10% | 18–25% | One-shot opportunity; subject line critical |
| InMail (personalised) | 18–25% | 30–40% | Deep personalisation referencing company or role context |
| Connection request with note → DM | 9.36% | 20–30% | Note primes the reply; DM does the work |
| Connection request without note → DM | 5.44% | 10–15% | Higher acceptance rate but lower primed intent |
| Group or event message | 9.39% (first message) | 15–20% | Shared context creates warm opening |
| Cold email (for comparison) | 1–5% | 8–12% | LinkedIn outperforms by 2.6–5× across the board |
The insight most teams miss: InMail open rates average 57.5%. Your message is almost certainly being seen. If your reply rate is low, the problem is not delivery — it is what happens after the open.
InMail open rates average 57.5%. Your message is almost certainly being seen. If replies are low, the problem is not delivery. It is what happens after the open.
LinkedIn Reply Rate Benchmarks by Industry
Industry is one of the strongest predictors of baseline reply rate. The gap between the highest and lowest performing verticals is large enough to completely change what “good” means for your campaigns.
| Industry | Average Reply Rate | What Drives Performance |
|---|---|---|
| Recruiting and Staffing | 18–25% | Candidates are actively open to opportunities; LinkedIn is an expected contact channel |
| Legal and Professional Services | 10.42% | Partnership and referral mindset; less saturated than tech |
| Healthcare | 9.25% | Efficiency messaging resonates; less inbox saturation than SaaS |
| Product and Operations | 10–10.24% | Actively seeking tools and workflow improvements; respond well to ROI framing |
| HR and Talent Acquisition | 12.08% | Role involves regular LinkedIn communication; familiarity with the channel |
| Marketing | 6.40% | High inbox volume; strong template detection; needs differentiated messaging |
| Sales | 6.32% | Receives outreach constantly; pitch-resistant; peer credibility essential |
| Software and SaaS | 4.77% | Highest inbox saturation of any vertical; generic messaging fails entirely |
A 10% reply rate in SaaS is strong. A 10% reply rate in recruiting means something is wrong. Always benchmark against your vertical — not the platform average.
Always benchmark against your vertical — not the platform average. This single adjustment changes how you read your own numbers.
LinkedIn Reply Rate Benchmarks by Job Title and Seniority
Seniority affects reply rate in ways that run counter to what most teams assume. C-suite is not the highest-responding group. Mid-level roles in operations and product consistently outperform senior leadership — because they have more inbox space, more active platform engagement, and a stronger direct stake in the problems most outreach tries to solve.
| Role / Function | Average Reply Rate | Outreach Consideration |
|---|---|---|
| HR and Talent Acquisition | 12.08% | LinkedIn is a native channel for this function; higher receptivity |
| Product | ~10.24% | Tool and workflow-focused; responds well to efficiency and outcome framing |
| Operations | ~10.02% | Process improvement mindset; ROI language lands well |
| C-Level and VP/Director | 6.98% | Time-poor; inbox-saturated; extremely brief messages with a specific strategic hook only |
| Marketing | 6.40% | Receives high outreach volume; template detection is strong |
| Sales | 6.32% | Peer-to-peer credibility and social proof matter more than product claims |
| Customer Success | ~6.00% | Lower prioritisation of external outreach; needs clear relevance signal |
C-suite reply rates are low because the messages executives receive are almost universally irrelevant — not because they have left the platform.
At the executive level, shorter messages with a precise strategic hook outperform long pitches every time. There is no room for preamble.
How Timing Affects LinkedIn Reply Rate
LinkedIn outreach timing is measurable and consistent across large datasets. The platform’s professional use patterns follow the working week closely, which creates predictable windows for higher engagement.
| Timing Factor | Benchmark | Recommendation |
|---|---|---|
| Best day | Tuesday (6.90% reply rate) | Send first messages and follow-ups on Tuesday or Wednesday |
| Second best day | Monday / Thursday (6.85%) | Monday has slight backlog risk from weekend accumulation |
| Best time window | 8–10 AM and 5–6 PM (local time) | Morning scroll before deep work; evening mobile use during commute |
| Avoid | Weekends (6.40% or lower) | Drop in professional context; recipients not in business mindset |
| Best month | January (7.51%), April (7.26%), July (7.00%) | Post-holiday and post-quarter fresh-start energy drives engagement |
| Worst months | October–December (6.36–6.44%) | End-of-year workloads and holidays suppress engagement; focus on nurturing warm leads |
Timing is a fine-tuning lever. It does not fix a bad message. But a good message sent at the wrong time still loses.
The timing insight worth internalising: the gap between the best and worst months is only 1.15 percentage points. Timing matters — but it is a fine-tuning lever, not a substitute for targeting and message quality.
The Four Variables That Actually Move LinkedIn Reply Rate

Across all the data, four variables consistently appear as the primary drivers of reply rate improvement. Understanding these in order of impact is more useful than optimising across all of them simultaneously.
Most teams try to fix reply rate by rewriting the message. The message is usually the last thing that needs fixing.
Personalisation: The Biggest Single Lever
Personalised messages referencing a specific post, role change, or company event see 27% higher reply rates than name-swapped templates. The distinction is simple: a message that could be sent to 500 people is a template, and recipients know it instantly.
True personalisation means your message could only have been written for this person. A first name and a company name in a merge field is not personalisation. It is formatting.
The numbers confirm the hierarchy: personalised connection request notes achieve 9.36% reply rates versus 5.44% for blank requests. AI-assisted first messages generate a 4.19% initial reply rate versus 2.60% for non-AI messages — but only when AI is used to generate context, not to automate generic sends.
Sequence Design: Most Replies Do Not Come From the First Message
Single-touch outreach leaves significant results unrealised. 80% of positive replies happen after the first message. Two to three follow-ups spaced 4–5 business days apart can push reply rates to 20–30%+ on campaigns that would otherwise stagnate at 6–8%.
80% of positive replies come after the first message. Most teams send one. Then wonder why the pipeline is thin.
The follow-up rule: each message needs a new reason to exist. A follow-up that just says “checking in” does not add value. It adds noise. A follow-up that references a new post, a company announcement, or a relevant data point keeps the conversation credible.
Targeting Precision: The Problem Upstream of Messaging
A reply rate below 10% is rarely a messaging problem. It is almost always a targeting problem. Broad lists send outreach to people who have no reason to be interested. Every irrelevant message that lands damages your reply rate — and through LinkedIn’s engagement quality monitoring, your account’s Trust Score.
Tightening ICP filters by job title, seniority, company size, industry, geography, and behavioural signals — recent posts, role changes, keyword activity — routinely doubles reply rates before a single word of the message changes.
Signal-Based Timing: Reaching People When the Context Is Hot
Outreach tied to a trigger event generates 32% higher reply rates than cold, context-free messages. The reason is simple: timing creates relevance. A message that references something that happened this week arrives when the recipient is already thinking about it.
This is the logic behind social signal-based outreach: rather than selecting prospects from a static list, identifying the moments when a prospect has created a natural opening for conversation. For more on how this works in practice, see our guide to how Konnector.ai uses the LinkedIn algorithm for smarter outreach.
What a Low LinkedIn Reply Rate Is Actually Telling You
A low reply rate almost always has a diagnosable cause. The most efficient approach is to diagnose the specific failure point — not adjust the message and hope.
| Reply Rate Signal | Most Likely Cause | Fix |
|---|---|---|
| Below 5% | Wrong audience entirely, or message reads as pure pitch | Rebuild ICP targeting from scratch; strip all pitch language from opening message |
| 5–10% | Audience is roughly right but personalisation is surface-level or follow-up is missing | Add signal-based personalisation; add at least one follow-up 4–5 days after first message |
| 10–15% | Targeting and messaging are functional but generic; structural similarity detectable | Deepen personalisation beyond name/company; test shorter messages; reference specific trigger events |
| 15–25% | Performance is good — optimisation is marginal gains | A/B test message length, CTA phrasing, and send timing; experiment with voice notes for high-value segments |
| 25%+ | System is working | Scale carefully while monitoring acceptance rate and reply-to-meeting conversion |
A reply rate below 5% is almost never a wording problem. It is an audience problem. Fix the list before you fix the copy.
LinkedIn Reply Rate and Account Health: The Connection Most Teams Miss
Reply rate is not just a performance metric. It is a compliance signal. LinkedIn’s 2026 engagement quality monitoring tracks reply rates silently — no notification, no warning — as part of its Volume Tax assessment. Accounts sending high-volume outreach with reply rates consistently below 10–15% risk having messages routed to the “Other” inbox, profile reach suppressed in search results, and organic content distribution reduced.
An account sending 500 messages per week with an 8% reply rate generates 40 replies. An account sending 200 messages with a 25% reply rate generates 50 — and signals health to the platform rather than triggering suppression.
LinkedIn does not tell you when it starts suppressing your outreach. It just quietly stops delivering it. Your reply rate is often the first sign something is wrong.
The math is simple: fewer, more relevant sends protect your account and generate more conversations than mass outreach ever will. For the full picture of how reply rate interacts with LinkedIn’s Trust Score system, see our breakdown of LinkedIn automation limits in 2026.
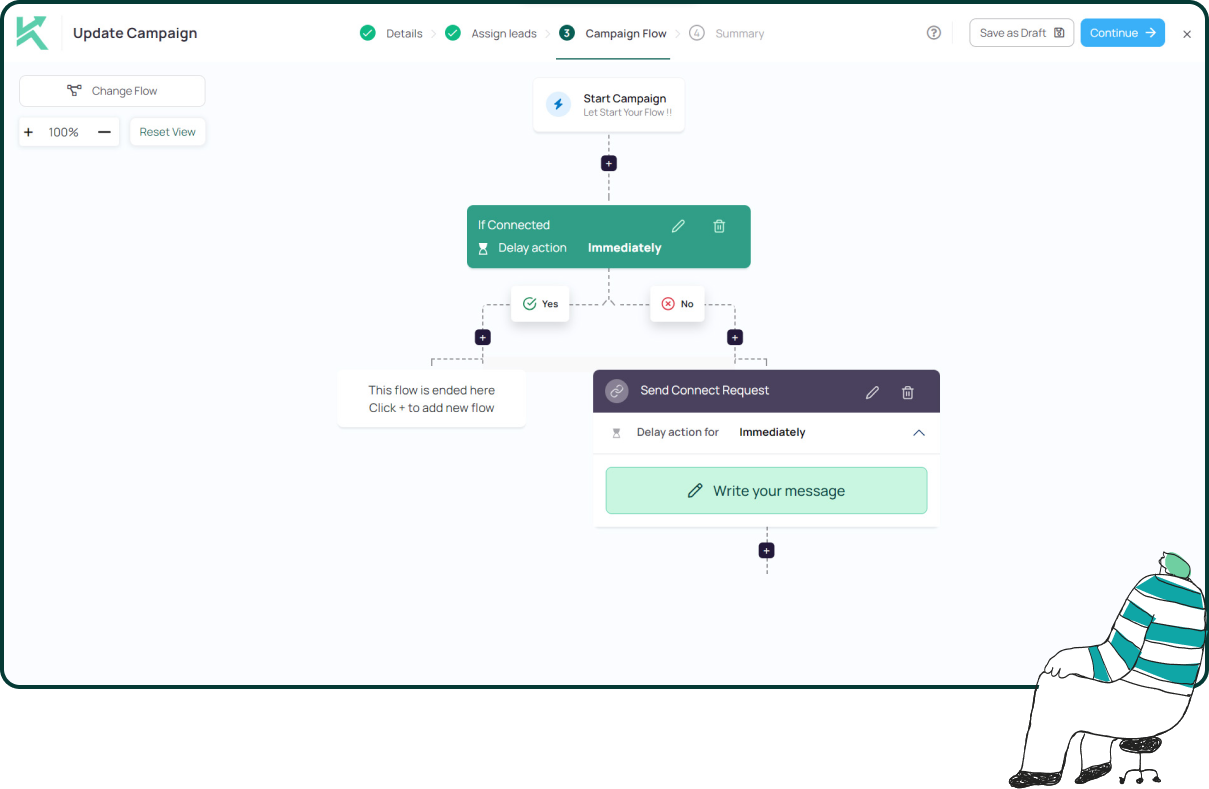
How Konnector.ai Approaches Reply Rate as a System Output
A strong reply rate is not the result of a better template. It is the result of a system where targeting, personalisation, sequencing, timing, and account health are all working together.
Konnector.ai’s Social Signals Intelligence identifies prospects at the moment they have created a natural opening for outreach: a post they published, a role they changed, a keyword conversation they entered. That context is the foundation of personalised first messages that feel relevant because they are relevant — not because they used a merge field.
The platform’s real-time acceptance rate monitoring adjusts outreach volume before reply rates drop to levels that trigger LinkedIn’s suppression systems. Every message in the sequence — first touch, follow-up, re-engagement — requires human approval before sending. Your reply rate improves because your outreach is more relevant. Your account stays healthy because the system is built to protect it.
📅 Book a Free Demo → See how Konnector.ai’s signal-based approach affects reply rates for your account type and ICP.
⚡ Sign Up Free → Start building outreach sequences built around intent signals, not volume.

Further Reading
- LinkedIn Compliance in 2026: A Complete Guide to Safe Automation
- LinkedIn Automation Limits 2026: The Complete Breakdown
- Daily LinkedIn Outreach Routine for Founders Using Konnector.AI
- LinkedIn Outreach and SSI: How Your Score Affects Automation Capacity
11x Your LinkedIn Outreach With
Automation and Gen AI
Harness the power of LinkedIn Automation and Gen AI to amplify your reach like never before. Engage thousands of leads weekly with AI-driven comments and targeted campaigns—all from one lead-gen powerhouse platform.
Frequently Asked Questions
A good LinkedIn reply rate in 2026 is 10–25% for most outreach. Hitting 15–25% indicates strong targeting and relevant messaging. Above 25% places you in the top tier. Anything below 10% is a signal to fix targeting, sequencing, or message relevance before increasing volume.
The average LinkedIn reply rate typically falls between 5–15%, depending on channel, audience quality, and message personalisation. Cold outreach sits at the lower end. Signal-based or warmed outreach consistently performs above the average.
Cold InMail response rates average 6–10%. Personalised campaigns from high performers reach 18–25%, with elite performers crossing 30%. Since open rates are high, low replies usually indicate weak messaging rather than delivery issues.
A low reply rate is rarely just a copy problem. It usually points to poor targeting, weak personalisation, lack of sequencing, or irrelevant outreach timing. Fixing the audience and context often improves results faster than rewriting the message.
Reply rate matters more. Acceptance rate shows someone allowed you into their network. Reply rate shows they found your message relevant enough to respond. Only replies create conversations and pipeline.
Improve targeting first, then personalise messages using real context like recent activity or role changes. Keep messages short, avoid pitching in the first message, and use 2–3 follow-ups with new reasons to engage.
Yes. Messages referencing specific context — such as posts, job changes, or company updates — outperform generic templates by a wide margin. Personalisation signals relevance, which directly impacts replies.
Yes. Shorter messages consistently perform better. Messages under 300 characters generate higher reply rates because they are easier to read and feel less like a pitch.
Two to three follow-ups spaced 4–5 business days apart deliver the best results. Most positive replies occur after the first message. Single-message outreach significantly limits conversion potential.
Recruiting and staffing typically see the highest reply rates due to active job-seeking behaviour. Professional services and HR perform moderately well. SaaS and tech often have lower reply rates due to inbox saturation.
Yes. Signal-based outreach — triggered by actions like engagement, profile views, or job changes — consistently generates higher reply rates because it aligns with real-time intent and relevance.
Yes. Mid-level professionals respond more frequently than senior executives. C-level leaders receive high message volume and require concise, highly relevant outreach to engage.
Reply rate is the earliest signal of outreach effectiveness. It reflects how well your targeting, messaging, and sequencing align with the recipient’s context. Higher reply rates lead directly to more conversations and pipeline.
Yes. LinkedIn’s system monitors engagement quality. Low reply rates combined with high send volume can lead to reduced visibility, messages landing in the “Other” inbox, and overall account suppression.
The best time is typically 8–10 AM or 5–6 PM in the recipient’s local time zone. Tuesdays, Mondays, and Thursdays perform best. Timing improves performance, but it cannot fix poor targeting or messaging.