In 2026, LinkedIn® is no longer just a professional networking platform — it is a real-time intelligence engine generating 75–85% of all B2B social media leads and hosting over 1.3 billion registered professionals. But with reach declining, the algorithm rebuilt from the ground up, and buyer behaviour shifting dramatically, posting without analytics is no longer a strategy — it is a gamble.
LinkedIn® replaced its entire content ranking infrastructure in late 2024 with an AI model called 360Brew, trained specifically on LinkedIn® data. The result: what used to go viral no longer does. Generic content is penalised. And the metrics that used to signal success — likes, follower count — have been overtaken by a new set of signals that most teams are not yet tracking.
LinkedIn® analytics now offer visibility into audience behaviour, engagement depth, content format performance, and outreach effectiveness — giving you the intelligence to fine-tune your messaging, content strategy, and sales outreach in ways that directly impact business outcomes.
Whether you are building a brand, generating qualified leads, recruiting top talent, or positioning as a thought leader — mastering LinkedIn® analytics in 2026 is not optional. It is competitive infrastructure.
The businesses that know how to interpret and act on LinkedIn® data will be the ones leading the market in visibility, engagement, and growth.
Why LinkedIn® Analytics Matter More Than Ever in 2026
Three platform shifts have made LinkedIn® analytics dramatically more important in 2026 than in any previous year:
1. The Algorithm Changed Everything
LinkedIn®’s 360Brew AI now evaluates every post for relevance, expertise alignment, and comment quality rather than raw engagement volume. Posts that used to reliably reach 10,000 people now reach 3,500 — but the engagement per post has actually increased by 12–39% year-over-year, because the people seeing it are more targeted. Total impressions per post have declined 63–66% since 2023, while quality engagement is up. Without analytics, you cannot separate the posts benefitting from this shift from those being suppressed by it.
2. New Signals Have Replaced Old Ones
LinkedIn® introduced Saves and Sends as tracked analytics metrics in 2025. A Save indicates highly valuable content a user wants to revisit. A Send indicates content shared privately — the highest trust signal available. Meanwhile, comments now carry 15x more algorithmic weight than likes. If you are still optimising for reactions, you are optimising for the wrong metric.
3. Dwell Time Is Now the Primary Distribution Signal
The 360Brew algorithm calculates a Depth Score from dwell time, comment thread depth, Saves, private shares, and content completion rates. Posts where users spend 31–60 seconds achieve maximum distribution. Posts scrolled in under 3 seconds receive minimal amplification. You cannot see or improve dwell time without analytics.
Data without action is just noise. Analytics turn visibility into strategy.
The LinkedIn® Analytics Metrics That Actually Matter in 2026
Before reviewing your analytics, you need to know which numbers are worth your attention. Here is the complete 2026 picture:
For Content Performance
| Metric | 2026 Benchmark | Why It Matters |
|---|---|---|
| Overall engagement rate (personal profile) | 3.85% average; 4–6% good; 6%+ excellent | Primary indicator of content resonance |
| Overall engagement rate (company page) | 2.1% average | Algorithm prioritises human-to-human interaction |
| Document / carousel engagement rate | 6.60–7.00% (highest format) | 360Brew rewards multi-page dwell time |
| Text post engagement rate | 2–3% | Lowest format; declining relative to documents |
| Comments vs. likes ratio | Comments carry 15x more weight | Comments signal depth of engagement to the algorithm |
| Saves per post | 5x more reach impact than a like | Strongest signal of valuable, referenceable content |
| Posts with external links | ~60% less reach than link-free posts | LinkedIn® suppresses outbound links in post bodies |
| First-hour engagement | Critical — only 5% of underperforming posts recover | 360Brew tests with 2–5% of your network first |
For Outreach and Sales
| Metric | Target Benchmark | What It Signals |
|---|---|---|
| Connection acceptance rate | 30–45% (good); below 20% = problem | ICP targeting quality and profile credibility |
| First-message reply rate | 10–15% (good); 5% = fix messaging | Message personalisation and value relevance |
| Positive reply rate | 50%+ of all replies showing interest | ICP alignment and offer relevance |
| Social Selling Index (SSI) | 70+ excellent; 75+ top 1% | Overall LinkedIn® presence and algorithm trust |
Using LinkedIn® Analytics to Refine Your Content Strategy
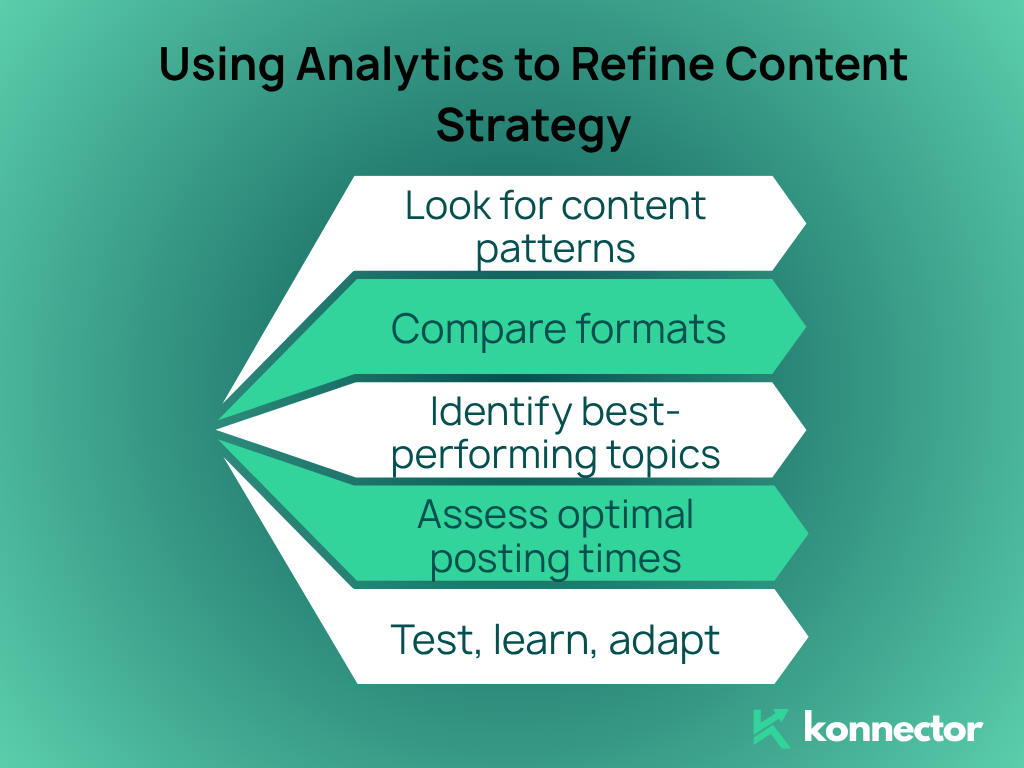
Tracking data is just the first step — the real value lies in applying it. Your LinkedIn® analytics should become your content compass, guiding what you post, how often, and in what format.
Look for Content Patterns
Are certain types of posts — like industry insights, data-backed frameworks, or behind-the-scenes content — consistently outperforming others? These trends show what resonates with your specific audience. In 2026, raw, unpolished behind-the-scenes posts and practical framework posts are outperforming polished corporate content across industries. The algorithm now rewards topical authority over production quality.
Compare Formats — with 2026 Data in Mind
Native document posts (PDFs / carousels) now average 6.60–7.00% engagement — the highest of any format, up 14% year-over-year. Standard text posts average 2–3%. Video views grew 36% year-over-year but are driven by a small number of large pages; the average creator saw a 36% drop in video views as LinkedIn® remains document-first in its architecture.
Posting images or video with external links in the body? Expect approximately 60% less reach. Move all external links to your first comment — or better yet, omit them from organic posts entirely and drive traffic through DMs and sequences instead.
Identify Best-Performing Topics Through Your Saves Data
LinkedIn®’s 2025 feature update added Saves and Sends as trackable analytics metrics. Sort your posts by Saves in the last 30 days. Identify your top 2–3 posts in that metric. What do they have in common — topic, format, length, hook? A Save is worth 5x more algorithmic reach than a like, and it tells you definitively which content your audience considers worth keeping.
Assess Optimal Posting Times
2026 engagement data confirms the following windows produce the highest performance:
- Best days: Tuesday to Thursday — 65% higher engagement than weekends
- Best times: 7–9 AM, 12–1 PM, and 5–6 PM in your audience’s timezone
- B2B specific: Tuesday to Wednesday, 8–10 AM EST sees the highest engagement for professional audiences
- First 60 minutes are critical — this is when 360Brew decides whether to expand distribution
Reply to every comment within the first two hours of publishing. Posts where creators engage with their own comments achieve 30% higher engagement across their lifecycle.
Test, Learn, Adapt
Posting and walking away is the single most common analytics mistake. The algorithm notices if you do not engage with your own comments. Try slight variations — different hooks, different CTA formats, different post lengths — and track each against your baseline engagement rate. A question-ended post generates 40–60% more comments than a statement-ended post. Even a 1% improvement in engagement compounds significantly over months of consistent posting.
Content without strategy is noise. Analytics help you publish with purpose.
Use this feedback loop to:
- Adjust your posting schedule based on your audience’s actual activity data — not generic advice
- Focus on document posts and carousels where the data is unambiguous
- Double down on topics generating the most Saves and Comments
- Retire low-engagement formats and reframe underperforming topics
Analytics aren’t there to judge you — they’re there to guide you.
The Social Selling Index (SSI): LinkedIn®’s Most Underused Analytics Tool
Most LinkedIn® users check their post analytics and ignore the one metric that most directly predicts their outreach and content success: the Social Selling Index (SSI).
Your SSI score (0–100, free at linkedin.com/sales/ssi) measures four pillars of social selling activity:
- Establishing a professional brand (0–25 points): Profile optimisation, consistent content, topical authority
- Finding the right people (0–25 points): Quality of targeting, use of search and filters, lead quality
- Engaging with insights (0–25 points): Post engagement quality, comment depth, conversation initiation
- Building relationships (0–25 points): Connection acceptance rate, follow-through after connecting, two-way engagement
The 2026 benchmarks:
- Below 40: Inconsistent activity, incomplete profile, no clear strategy
- 40–60: Active but unfocused — some content, some connections, no clear pillar strategy
- 60–75: Consistent and strategic — one weak pillar pulling the total down
- 75+: Top 1% of your industry — the algorithm actively favours your content distribution
Data from Martal Group confirms: sellers with high SSI create 45% more opportunities and are 51% more likely to hit quota. Your SSI also directly influences your weekly connection request capacity — accounts with SSI above 65 and acceptance rates above 40% can safely send up to 200 requests per week, while restricted accounts are capped at 50.
Your lowest SSI pillar tells you exactly what to fix next. Use it as a diagnostic tool, not a vanity metric.
Running LinkedIn® outreach campaigns alongside your content? Konnector.ai monitors your SSI and acceptance rate in real time, adjusting your outreach volume before LinkedIn®’s algorithm acts. Book a free demo to see how it works for your team.
How Often Should You Review LinkedIn® Analytics?
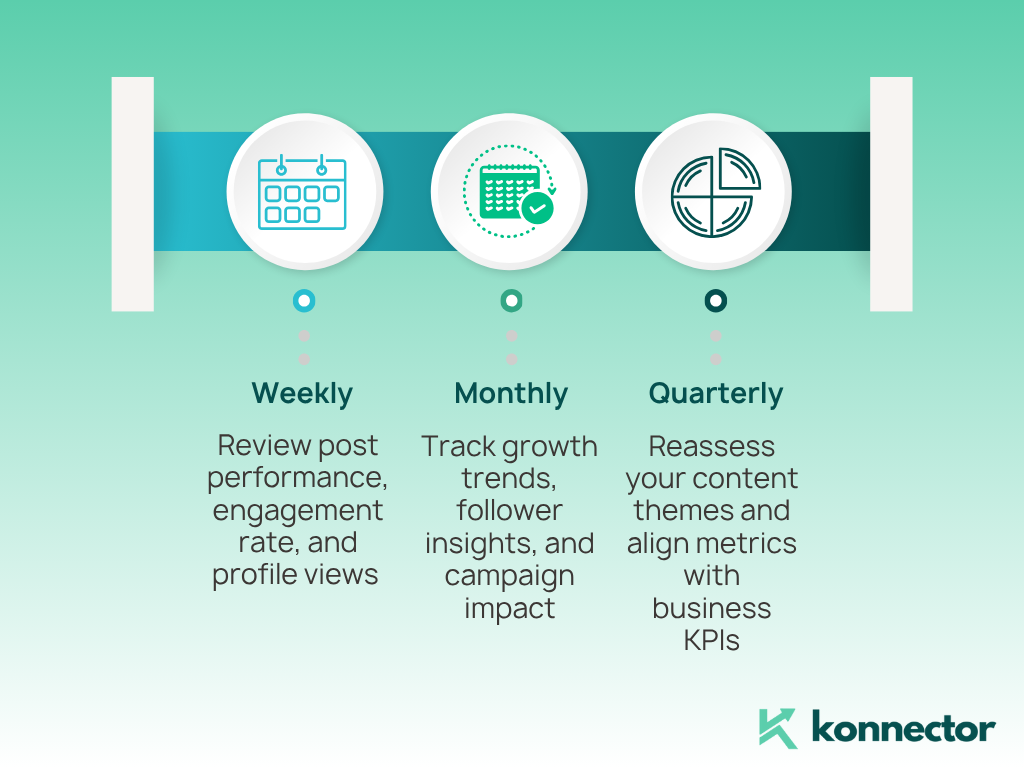
Weekly
Review post performance, engagement rate, Saves, profile views, and SSI movement to maintain a real-time pulse on what is working. In 2026, the first week of a post’s life determines most of its total reach. A weekly review lets you identify high performers immediately (and engage with them more aggressively), catch underperformers before they pull down your account’s algorithmic standing, and respond to shifts in audience interest as they happen. Also check: are your connection requests being accepted at above 30%? If not, fix it before scaling volume.
Monthly
Track follower growth, audience demographic shifts, content theme performance, and campaign impact at a broader level. Dive into which content themes drove the most Saves and Comments — these are your highest-authority topics. Review your audience demographics (job titles, industries, seniority levels) to confirm you are attracting your ICP rather than a general audience. If your follower growth is strong but lead conversion is weak, your content is too broad — a monthly review reveals this pattern before it wastes quarters of effort.
Quarterly
Reassess your content themes, format strategy, and alignment with business KPIs. Step back to evaluate whether your LinkedIn® strategy is moving the needle on specific outcomes — brand awareness, qualified pipeline, recruitment reach, or thought leadership positioning. Identify which content formats are trending up in engagement for your specific audience. Retire anything consistently underperforming. Set updated benchmarks based on your account’s own trajectory, not just platform averages. And review your SSI score against the quarter-ago baseline — which pillar moved most, and which most needs attention?
Consistency builds momentum, but reflection ensures you are heading in the right direction.
LinkedIn® Analytics Best Practices for 2026
Track Saves and Sends — Not Just Likes
LinkedIn®’s 2025–2026 analytics update added Saves and Sends as accessible metrics. Sort your posts by Saves in the last 30 days. This is your most reliable signal of high-value content — the posts worth repurposing, expanding into newsletters, or turning into LinkedIn® document posts. A Save indicates your audience considers the content worth returning to. A Send indicates they trusted it enough to share privately with someone else. Both are dramatically stronger signals than a like or a reaction.
Use UTM Links on Every External Link You Share
UTM parameters allow you to track exactly how much traffic your LinkedIn® activity is driving to your website, landing pages, or lead magnets. Without UTM tagging, LinkedIn® traffic appears in Google Analytics as “Direct” — invisible and unattributable. Add UTM tags to every external link you share (in comments, DMs, or your Featured section), so instead of guessing where your clicks originate, you get exact source and campaign data. This is non-negotiable for any team attributing pipeline to LinkedIn®.
Export and Build Your Own Tracker
LinkedIn®’s native dashboard is a starting point, not a complete system. Export your analytics data as a CSV and build a tracker in Google Sheets, Looker Studio, or your CRM. Compare week-on-week, month-on-month, and post-type-to-post-type results. The platform’s dashboard does not show you trend lines, format comparisons, or the correlation between SSI movement and outreach performance. Your own tracker does — and it compounds in value every week you use it consistently.
Tag and Categorise Your Posts
An internal tagging system — even a simple spreadsheet column — allows you to group posts by theme (thought leadership, product insight, case study, team story, data post) and track which content buckets perform best across quarters. Over time, this reveals not just what format works but what topic works — the combination of format and subject matter that consistently earns the highest Saves and Comments from your specific audience.
Watch Your Dwell Time Proxies
LinkedIn® does not surface dwell time as a direct metric in the native dashboard — but you can infer it. Posts with high comment thread depth signal long dwell time, because people are reading enough to respond substantively. Document posts with high completion rates (trackable via Stories or third-party tools) indicate people scrolled the full carousel. Structure your posts specifically to increase dwell: use multi-slide documents, ask a question that requires readers to think, and build posts that reward completion with a payoff at the end.
Compare Formats Rigorously — and Be Willing to Be Surprised
Do not assume your audience behaves like the platform average. Run your own format experiments for 30–60 days: three document posts, three text posts, three single-image posts, each on similar topics. Track engagement rate, Saves, Comments, and profile views generated per post. The platform average says documents win — but your specific audience, industry, and topic mix may show different results. Act on your data, not on generic advice.
Metrics give you direction — best practices give you the tools to act on them.
LinkedIn® Analytics: The 2026 Benchmarks at a Glance
| Metric | Below Average | Average | Good | Excellent |
|---|---|---|---|---|
| Personal profile engagement rate | Below 2% | 3.85% | 4–6% | 6%+ |
| Company page engagement rate | Below 1% | 2.1% | 2.5–4% | 4%+ |
| Document post engagement rate | Below 4% | 6.60–7.00% | 8% | 10%+ |
| SSI score | Below 40 | 40–60 | 60–75 | 75+ |
| Connection acceptance rate | Below 20% | 20–30% | 30–45% | 45%+ |
| Message reply rate | Below 5% | 5–9% | 9–15% | 15%+ |
| Profile views to connection rate | Below 5% | 5–10% | 10–20% | 20%+ |
Final Thoughts
LinkedIn® analytics in 2026 is no longer just a tool for social media managers checking post likes at the end of the week. It is a strategic intelligence system for marketers, founders, and sales teams — one that tells you which content is earning algorithmic trust, which outreach is converting into pipeline, which topics your audience is bookmarking, and exactly which pillar of your LinkedIn® presence needs attention.
The platform has changed more in the last 18 months than in the previous five years. The 360Brew algorithm, the Volume Tax on outreach, the rise of Saves as a primary signal, the suppression of external links, the decline of likes as a meaningful metric — these are not minor updates. They are fundamental shifts that require a fundamentally updated approach to measurement.
The businesses winning on LinkedIn® in 2026 are not the ones posting most frequently or connecting most aggressively. They are the ones whose analytics feedback loop is tight enough to tell them — every week, every month, every quarter — exactly what is working, what is not, and what to do next.
Listen to your data. It already knows what your audience wants.
Whether you are aiming for reach, reputation, or revenue — your metrics hold the roadmap. Sign up to Konnector.ai free to start tracking your LinkedIn® outreach analytics in real time alongside your content performance — so your content strategy and your pipeline strategy finally talk to each other.
📅 Book a Free Demo → See how Konnector.ai’s analytics dashboard connects your LinkedIn® content signals to your outreach performance in one view.
Related Reading from Konnector.ai
- How Does LinkedIn® Outreach Work in 2026? (Step-by-Step Strategy Guide)
- Best Time to Schedule LinkedIn® Outreach Messages (2026 Data)
- LinkedIn® Automation in 2026: Safe Tools, Limits & Expert Strategies
- Daily LinkedIn® Routine for Founders Using Konnector AI
11x Your LinkedIn® Outreach With
Automation and Gen AI
Harness the power of LinkedIn® Automation and Gen AI to amplify your reach like never before. Engage thousands of leads weekly with AI-driven comments and targeted campaigns—all from one lead-gen powerhouse platform.
Frequently Asked Questions
Three cadences: weekly (post performance, engagement rate, Saves, profile views, SSI movement), monthly (follower growth, audience demographic data, content theme analysis, outreach campaign impact), and quarterly (KPI alignment, format strategy, benchmark resetting, SSI pillar diagnosis). Do comments really matter more than likes on LinkedIn® in 2026? Yes — significantly so. LinkedIn®’s 360Brew algorithm assigns comments 15x more algorithmic weight than likes. A single thoughtful comment generates more distribution signal than 15 reactions. This is why posts ending with a specific question consistently outperform those ending with a statement — and why replying to every comment within the first two hours of posting increases a post’s total lifetime engagement by approximately 30%. How do I track LinkedIn® analytics for outreach, not just content? Use LinkedIn®’s native analytics for content performance, and track outreach metrics manually or through your CRM: connection acceptance rate (target 30–45%), first-message reply rate (target 10–15%), positive reply rate (target 50%+ of replies showing interest), and meetings booked as a percentage of total contacts. Your SSI score’s “Finding the right people” and “Building relationships” pillars are the native signals most directly tied to outreach performance.
A good LinkedIn® engagement rate in 2026 is 4–6% for personal profiles. The platform average is 3.85% for personal profiles and 2.1% for company pages. Rates above 6% are excellent. Document and carousel posts consistently lead, averaging 6.60–7.00% engagement — the highest of any LinkedIn® format, up 14% year-over-year.
Native document posts (PDF carousels) lead all LinkedIn® content formats in 2026 with an average engagement rate of 6.60–7.00%, up 14% year-over-year. Standard text posts average 2–3%. External links placed in post bodies receive approximately 60% less reach than posts without them — always put links in your first comment, not the post itself.
In 2026, the highest-signal LinkedIn® metrics are: Saves (5x more algorithmic reach than a like), Comments (15x more weight than likes in 360Brew’s ranking), Dwell time (posts with 31–60 second dwell receive maximum distribution), SSI score (predicts sales outcomes and sending capacity), and for outreach: connection acceptance rate and reply rate.
The LinkedIn® Social Selling Index (SSI) is a score out of 100 measuring your effectiveness across four pillars: professional brand, finding the right people, engaging with insights, and building relationships. Scores above 70 are excellent. Check yours free at linkedin.com/sales/ssi — no Sales Navigator required. Sellers with high SSI scores create 45% more opportunities and are 51% more likely to hit quota.