Your dashboard says the campaign is working. Hundreds of invites sent. Thousands of profile views. A big green number going up and to the right.
And yet the calendar looks empty.
That gap has a cause. Most teams measure LinkedIn automation by activity, not outcomes. The tool reports what it did, so that becomes what gets tracked. But activity is not pipeline. The metrics that actually matter are the ones that predict booked meetings, and there are fewer of them than you think.
This guide covers which LinkedIn automation metrics deserve your attention, the benchmarks to hold them against, and the vanity numbers you can safely ignore.
What Are LinkedIn Automation Metrics?

LinkedIn automation metrics are the performance indicators that show whether your automated outreach is converting strangers into conversations, and conversations into pipeline. They fall into three layers: deliverability metrics (can your messages get through), engagement metrics (are people responding), and revenue metrics (is any of it turning into meetings and deals).
Most reporting stops at the first layer. That is the mistake.
Invites sent, messages delivered, and profiles viewed describe effort. They say nothing about results. A campaign can hit every activity target and still produce zero meetings. The decision-maker’s job is to measure the second and third layers, because that is where the money is.
Which LinkedIn Automation Metrics Should You Track?

Track five core metrics: acceptance rate, reply rate, positive reply rate, meetings booked, and lead-to-opportunity conversion. Everything else is either an input to these five or noise.
| Metric | What It Tells You | Healthy Benchmark |
|---|---|---|
| Acceptance rate | Whether your targeting and profile earn trust | 30–45% |
| Reply rate | Whether your messaging starts conversations | 8–15% |
| Positive reply rate | Whether you are reaching the right people | 30–50% of all replies |
| Meetings booked | Whether conversations convert to pipeline | 1–3 per 100 accepted connections |
| Lead-to-opportunity rate | Whether the leads are worth pursuing at all | Trending up month over month |
Notice what is missing. Invites sent. Profile views. Total connections. None of them appear, because none of them predict revenue on their own.
A metric matters if changing it changes your pipeline. If you can double the number without booking a single extra meeting, it was never a metric. It was a scoreboard.
Why Is Acceptance Rate the First Metric That Matters?
Acceptance rate is the gatekeeper metric: if prospects don’t accept, they never see your message, your follow-up, or your offer. An analysis of 500,000 connection requests by Emailsearch.io puts the cross-industry average at roughly 30%. Well-run B2B campaigns should sit between 30% and 45%.
But there is a second reason this number comes first. LinkedIn watches it too.
Acceptance rate is the primary signal LinkedIn uses to decide whether your account is a trusted networker or a spammer. Fall below 20%, and your weekly invite capacity can shrink to as few as 50 requests. Stay consistently above 40%, and it can expand toward 200. Your acceptance rate literally sets the size of your outreach engine. We break down the full mechanics in our guide to what counts as a good acceptance rate for automated connection requests.
The fastest lever here is not the note. It is the timing. Cold, context-free requests average 20–30% even with decent targeting. Requests sent after a real touchpoint, such as a comment, a shared post, or a profile visit from the prospect, can clear 60%. Warm beats clever, every time.
What Is a Good Reply Rate for LinkedIn Automation?
A good reply rate for automated LinkedIn outreach sits between 8% and 15%, with top campaigns exceeding 25%. If you are below 5%, the problem is almost always the message, the list, or both.
The most useful data here comes from Belkins’ study of over 20 million LinkedIn outreach attempts. Two findings should change how you run campaigns.
First, personalisation does not help where most people think it does. Requests with a note and without a note get accepted at almost identical rates: 26.42% versus 26.37%. But the reply rate afterwards jumps from 5.44% to 9.36% when a note is present. That is a 72% lift, and it happens after the accept, not before.
“If your primary goal is to expand your network, connection requests without a message perform just as well. However, if you aim to initiate conversations or generate leads, always include a short, relevant, and personalized message.” — Yuriy Boyko, Head of Account Management at Belkins
Second, persistence pays, but only when it adds value. The same study found reply rates climb steadily with each nurturing touch, from around 1% on a single action to over 5% across five. Most replies live in the follow-up sequence your team was too polite to send.
One caveat for software companies: expect a lower baseline. SaaS records the weakest reply rates of any sector, at under 5%, largely because its buyers are drowning in automated outreach. Judge your campaigns against your industry, not the global average.
Which LinkedIn Automation Metrics Are Vanity Metrics?

A vanity metric is any number that grows without moving pipeline. They are comfortable to report and dangerous to optimise. Here is the honest translation table.
| Vanity Metric | Why It Misleads | Track Instead |
|---|---|---|
| Invites sent | Measures effort, not interest. Pushing volume can lower acceptance and trigger limits. | Acceptance rate |
| Total connections | A big network of silent contacts is a contact list, not a pipeline. | Conversations started |
| Profile views | Curiosity is not intent. Views convert at unpredictable rates. | Positive reply rate |
| Messages delivered | Delivery is guaranteed on LinkedIn. It signals nothing. | Reply rate |
| Campaign size | Bigger lists usually mean looser targeting and weaker results per lead. | Meetings per 100 accepts |
The pattern is consistent. Every vanity metric has a working metric hiding one step behind it. Report the second one.
How Do You Connect Automation Metrics to Actual Pipeline?

Connect the metrics by tracking one number per funnel stage, so you can see exactly where prospects leak out. Acceptance tells you the door opened. Reply tells you a conversation started. Positive reply tells you it was the right conversation. Meetings booked tells you it went somewhere.
Then add the metric almost nobody tracks: disqualification rate. A healthy outbound motion filters people out on purpose. If nothing gets disqualified, your qualification criteria are not being applied, and your later-stage numbers will quietly rot. We cover why that matters in our breakdown of how to qualify leads before they reach your pipeline.
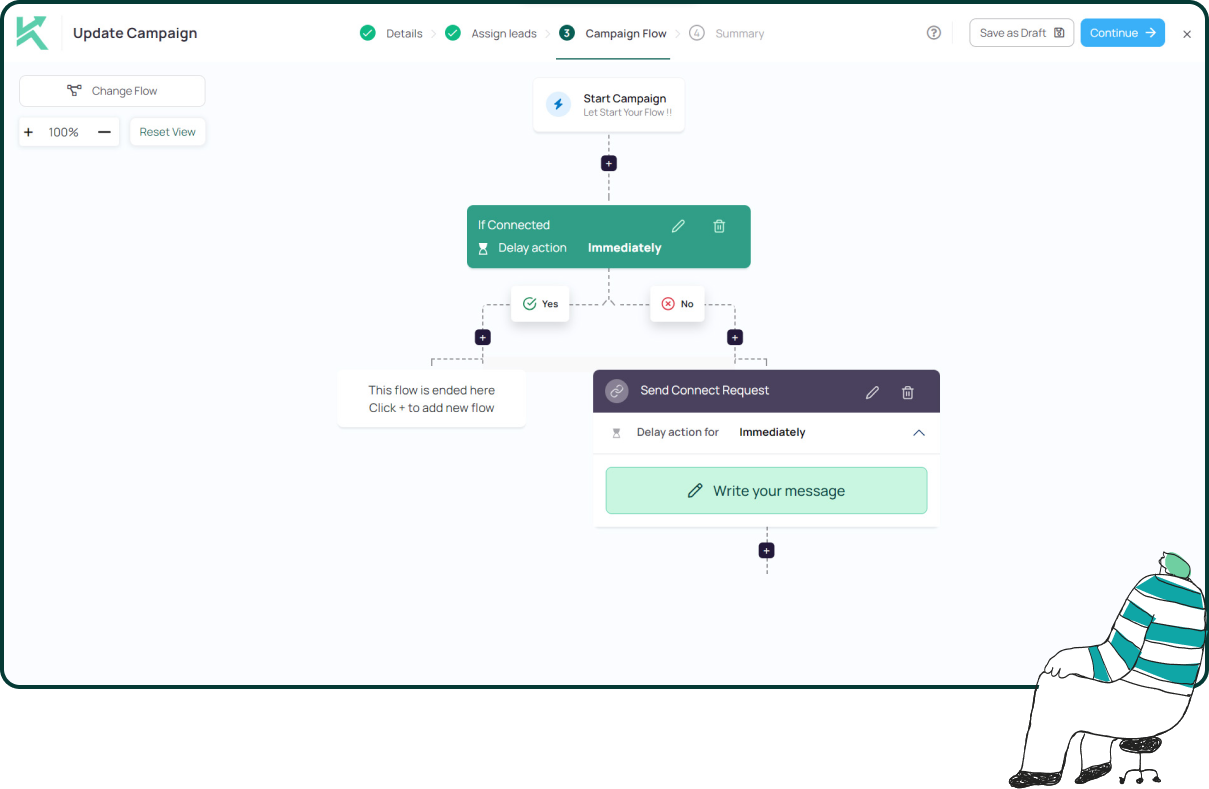
This is also where tooling earns its keep. When outreach runs across LinkedIn and email, and replies scatter across inboxes, funnel metrics become guesswork. Konnector.ai keeps the whole chain measurable in one place: campaign-level acceptance and reply tracking, a unified inbox so no response slips through, buying-signal data showing who engaged and not just how many, and a HubSpot sync that carries every conversation into the CRM where meetings and revenue are counted. The metric chain stays unbroken from first invite to closed deal.
⚡ Try it free → See your acceptance, reply, and meeting metrics in one dashboard from day one.
How Often Should You Review LinkedIn Automation Metrics?

Review campaign metrics weekly and funnel metrics monthly. The two cadences answer different questions.
The weekly review is operational. Check acceptance rate and reply rate per campaign. Kill or fix anything under 20% acceptance before LinkedIn does it for you. Pause message variants that are dragging replies down. Small, fast corrections.
The monthly review is strategic. Look at meetings booked, lead-to-opportunity conversion, and disqualification rate across all campaigns. This is where you spot the deeper problems: a targeting drift, a message that attracts the wrong buyers, a channel that books meetings which never close.
One discipline makes both reviews sharper. Never look at a rate without its volume. A 60% acceptance rate on 10 invites is an anecdote. The same rate on 400 invites is a strategy.
The Bottom Line

LinkedIn automation metrics only matter when they trace a straight line to revenue. Acceptance rate opens the door. Reply rate starts the conversation. Positive replies, meetings, and lead-to-opportunity conversion tell you whether any of it was worth automating.
Measure those five. Ignore the scoreboard numbers. And review on a rhythm, so the data changes your decisions instead of decorating your reports.
📅 Book a Free Demo → See how Konnector.ai tracks every metric in this guide, from first signal to booked meeting.
⚡ Sign Up Free → Launch your first measurable LinkedIn campaign today.
11x Your LinkedIn® Outreach With
Automation and Gen AI
Harness the power of LinkedIn® Automation and Gen AI to amplify your reach like never before. Engage thousands of leads weekly with AI-driven comments and targeted campaigns—all from one lead-gen powerhouse platform.
Frequently Asked Questions
Acceptance rate is usually the first metric to monitor because it determines whether prospects will even see your outreach. However, meetings booked and lead-to-opportunity conversion are the metrics that ultimately indicate business impact.
For most B2B campaigns, an acceptance rate between 30% and 45% is considered healthy. Rates below 20% often indicate poor targeting or irrelevant outreach and may even reduce your LinkedIn invitation limits.
A reply rate between 8% and 15% is generally considered strong for automated LinkedIn outreach. High-performing campaigns with excellent targeting and personalization can exceed 20%.
Metrics such as profile views, invites sent, and total connections can create the impression of success without generating qualified opportunities. Businesses should prioritize metrics that directly influence conversations, meetings, and revenue.
Campaign performance metrics like acceptance and reply rates should be reviewed weekly, while pipeline metrics such as meetings booked and lead conversion are better evaluated monthly to identify long-term trends.
The most effective way is to track the complete funnel—from accepted connection requests to replies, booked meetings, qualified opportunities, and ultimately closed revenue. This provides a clear picture of how outreach contributes to business growth.
Yes. When combined with accurate targeting, personalized messaging, and consistent follow-up, LinkedIn automation can generate qualified conversations that translate into a stronger sales pipeline rather than simply increasing outreach volume.
Sales teams should avoid optimizing solely for activity metrics such as messages sent, profile views, or campaign size. These numbers may increase without producing more qualified leads or booked meetings.
Positive reply rate measures genuine buying interest rather than overall engagement. It helps distinguish qualified prospects from people who simply respond to decline, unsubscribe, or ask unrelated questions.
Start by reviewing your targeting, messaging, and outreach cadence. Low acceptance rates usually indicate targeting issues, while declining reply rates often suggest your messaging or follow-up sequence needs improvement. Regular testing and optimization help maintain healthy campaign performance.